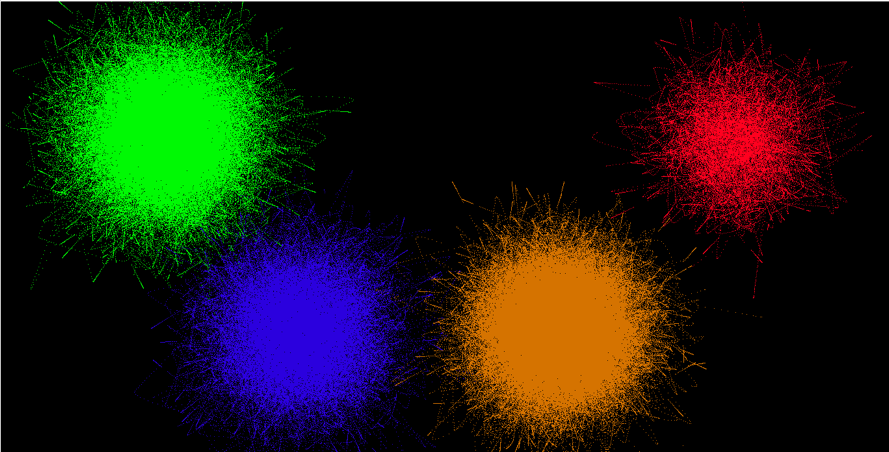
The “Observatory of an Ecosystem of Emotions” consists of a data visualization generated by the monitoring of predefined hashtags on Twitter themed around the Brazilian presidential election of 2018. We collected tweets that used trending hashtags during controversial campaign moments and applied Digital Methods and Data Science approaches to Sentiment Analysis. We used Processing and VVV to create generative art visualizations based on the contextual mining of the tweets’ text categorized by six emotions: pride, sadness, joy, fear, love and anger.
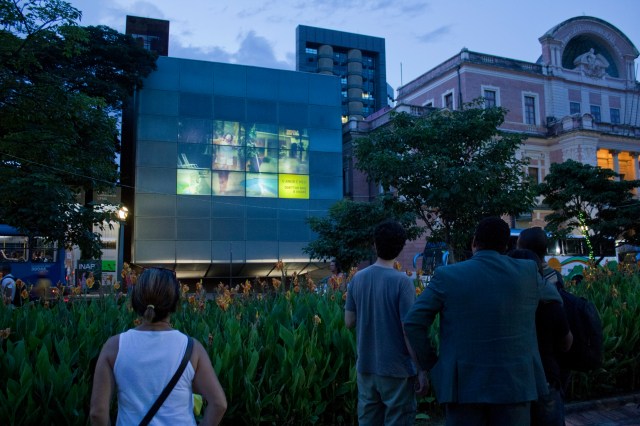
This experiment proposed a live data visualization on a large screen on the building’s facade at the University’s “Espaço do Conhecimento” museum. The museum is located at Praça da Liberdade, in Belo Horizonte, a recurring site of political protests in October 2018.
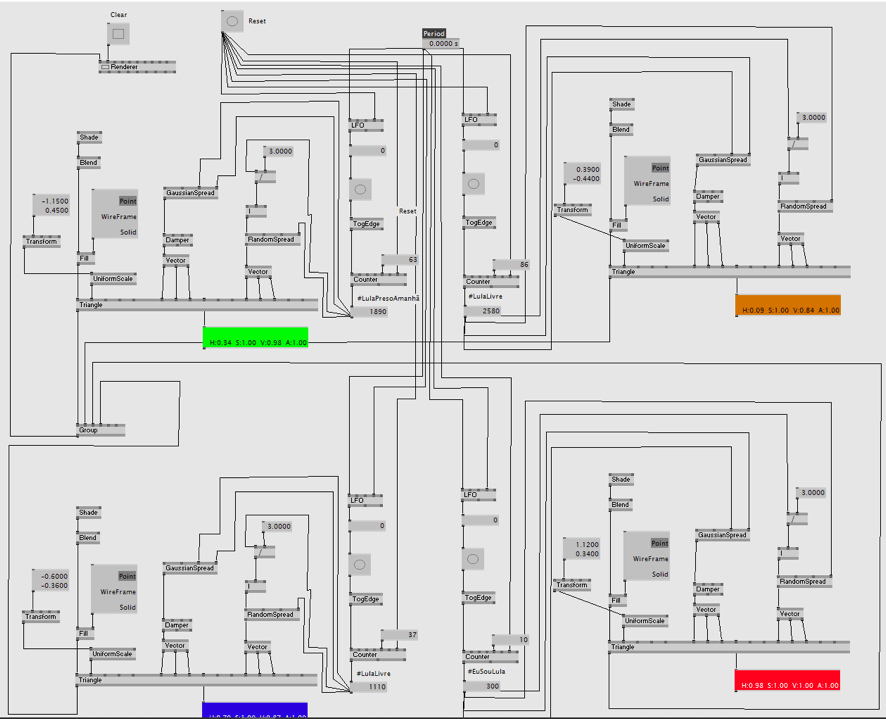
Screenshot of VVVV interface 
A first exercise of data visualization based on hashtags
We proposed a live data visualization at the museum’s facade that resulted from geolocated tweets originating from the square perimeter . However, given the sensitive political climate in the country, it was not possible to do a live demonstration of this project. Download research report (in Portuguese).
